
Polymer
No-code dashboards for connected business data
What is Polymer?
Polymer turns spreadsheet and connected business data into interactive dashboards without requiring SQL. It works especially well for quick marketing, sales, and e-commerce reporting when a full BI deployment would be excessive.
Building a report in Polymer
Start with an uploaded CSV or Excel file, a Google Sheet, or a supported SaaS connector. Polymer profiles columns and assigns each field a useful role, so dates, measures, and categories are easier to place into charts. The board editor combines scorecards, tables, visualizations, text, and page-level filters. Natural-language analysis can surface patterns or answer straightforward questions, while shared links and embeds make finished work accessible outside the editor.
Where it makes sense
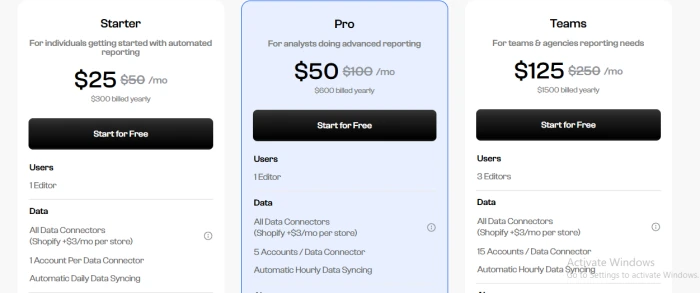
The product sits between a spreadsheet chart builder and a traditional BI platform. Setup is light, but it offers less control over semantic models, transformations, and governance than tools built around a data warehouse. Polymer is sold by subscription; plan limits center on connector access, data capacity, refresh frequency, collaboration, and embedding.
- Choose it for speed: recurring operational reports can be assembled with little technical setup.
- Check source coverage: confirm that every advertising, commerce, or analytics account you need is supported.
- Plan data preparation: complicated joins and cleanup may still require work before import.
Pricing :
Highlights & limitations
- Field detection removes much of the manual setup normally required before charting a new dataset.
- The visual editor is approachable for teams that do not write SQL or manage BI infrastructure.
- Finished boards have a clean presentation suitable for client and stakeholder reporting.
- Filters let viewers explore reports without receiving access to the underlying editing workspace.
- The available SaaS connector catalog is narrower than that of established enterprise BI platforms.
- Large, inconsistent, or heavily relational datasets usually need preparation in another tool first.
- Advanced calculations and reusable semantic modeling are limited compared with warehouse-focused BI software.
- Subscription requirements can become more expensive as teams need additional sources, frequent refreshes, or embedding.
- AI analysis works best for direct questions and can miss context in ambiguous business metrics.
Polymer in pictures
Used it? Share your experience — it helps the next person decide.