

Polymer turns spreadsheet and connected business data into interactive dashboards without requiring SQL. It works especially well for quick marketing, sales, and e-commerce reporting when a full BI deployment would be excessive.
ChartGPT
AI chart maker for pasted data
Overview
What is ChartGPT?
ChartGPT turns plain instructions, spreadsheet rows, or CSV data into downloadable charts for reports, presentations, and class projects.
From pasted rows to a finished graphic
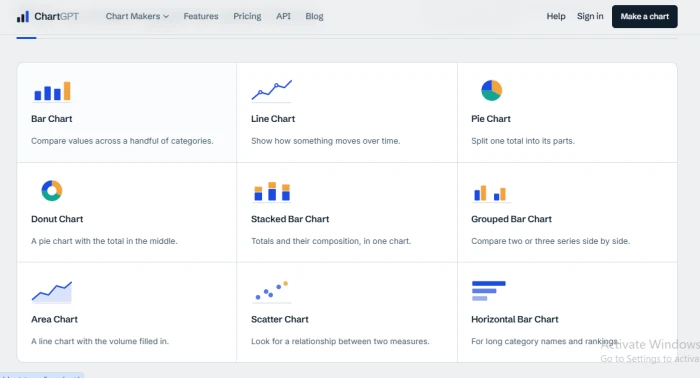
ChartGPT keeps chart creation deliberately narrow. Paste a table copied from Excel or Google Sheets, enter CSV content, or describe a small dataset in ordinary language. The tool interprets the values, selects a suitable visualization, and produces a chart without formulas or manual series configuration. Nine formats cover common needs: bar, line, pie, donut, area, scatter, grouped bar, stacked bar, and horizontal bar. Results can be saved as PNG for quick sharing, SVG for editing at any size, or PDF for documents and printing. The chart maker is available to use free, making it practical for occasional work.
Use it for quick visuals, not deep analysis
- Do: Use it when you need a clean, standalone graphic from a small, well-structured dataset.
- Do: Check labels and category assignments before placing the result in a client report.
- Don't: Treat it as a replacement for Excel, Tableau, or a business intelligence dashboard.
- Don't: Expect unusual chart forms, live data connections, or extensive analytical controls.
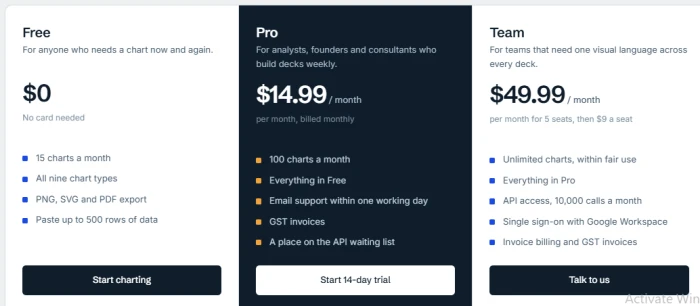
Pricing
The honest read
Highlights & limitations
What stands out
- Creating a basic chart takes little setup because data can be pasted directly from a spreadsheet.
- SVG and PDF downloads are useful when a raster image is not suitable for editing or print.
- The supported layouts cover most charts needed for straightforward presentations and school assignments.
Worth knowing
- Nine chart types leave little room for specialist visualizations such as heatmaps, radar charts, or box plots.
- Automatic chart selection can still require checking when labels, dates, or grouped categories are ambiguous.
- It lacks the live connections, calculations, filtering, and dashboards expected from full analytics software.
Considering a switch?
ChartGPT’s alternatives
No reviews for ChartGPT yet.
Used it? Share your experience — it helps the next person decide.
Used it? Share your experience — it helps the next person decide.