
Polymer turns spreadsheet and connected business data into interactive dashboards without requiring SQL. It works especially well for quick marketing, sales, and e-commerce reporting when a full BI deployment would be excessive.
RAWGraphs
Open-source tool for custom data visualizations
Overview
What is RAWGraphs?
RAWGraphs turns tabular data into distinctive, publication-ready charts without requiring code or an account.
From table to graphic
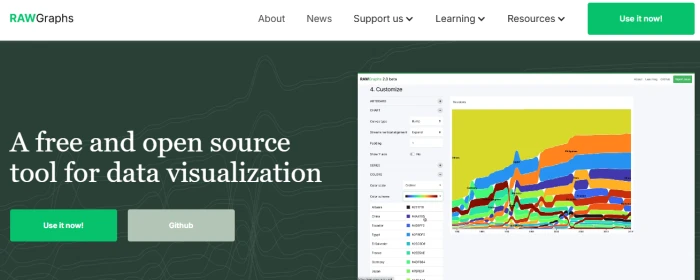
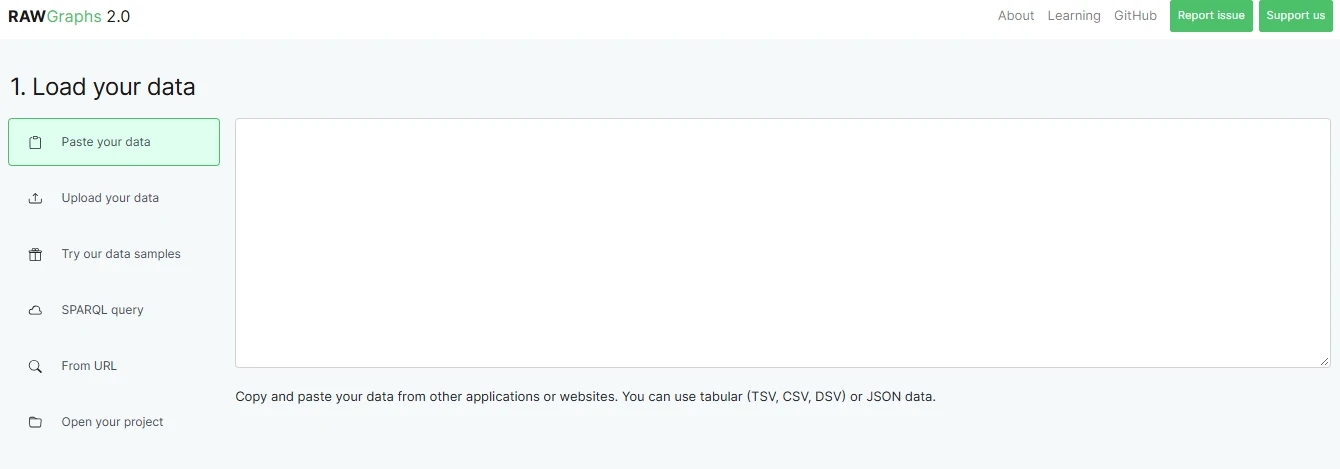
RAWGraphs occupies the useful middle ground between a spreadsheet chart menu and a visualization library such as D3.js. Paste a table or load a supported file, pick a chart model, then drag columns into visual dimensions such as size, color, hierarchy, and labels. Processing happens in the browser, so sensitive rows are not uploaded to a remote analysis service. The chart catalog is especially useful when standard bars and lines are insufficient, with options suited to flows, distributions, hierarchies, and relationships. This is a chart maker rather than a hosted dashboard platform: there are no live reports, team workspaces, or scheduled refreshes.
Where RAWGraphs fits
Editorial graphics: A journalist can turn election totals or budget data into a bump chart, alluvial diagram, or packed layout before finishing typography elsewhere.
Analysis and teaching: Analysts and instructors can test how different visual forms expose structure in the same dataset without writing chart code.
Design handoff: Designers can generate an initial composition, export editable vectors, and refine spacing, annotations, and branding in Illustrator or another vector editor.
The honest read
Highlights & limitations
What stands out
- The unusual chart catalog goes well beyond typical spreadsheet options.
- No account, subscription, or installation is required for the hosted version.
- Local browser processing is valuable when a dataset should not be uploaded.
- SVG output provides a practical route into professional design tools for final polishing.
Worth knowing
- It does not create interactive dashboards or charts connected to live data.
- Large or dense datasets can become slow and visually unwieldy.
- Dimension mapping takes experimentation when a chart model is unfamiliar.
- Label placement and fine typography often need cleanup after export.
- Data preparation remains your responsibility; inconsistent tables can produce confusing results.
See it in action
RAWGraphs in pictures
Product
screenshot
Considering a switch?
RAWGraphs’s alternatives
No reviews for RAWGraphs yet.
Used it? Share your experience — it helps the next person decide.
Used it? Share your experience — it helps the next person decide.